The Power and Synergy of Imagery and GIS
Russell G. Congalton
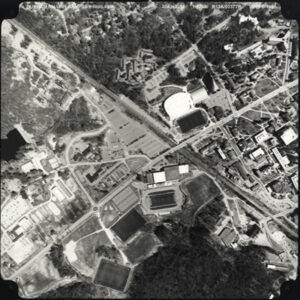
In the beginning there was the aerial photograph. Initially, only in black and white, but soon along came color to really brighten things up. So much information could be gleaned from these photographs without having to travel to sites yourself. Not only could a viewer tell what the current conditions of the area were, but they could compare the area to previous photos and see what changed. Then color infrared film was invented, giving us the ability to see in a wavelength of electromagnetic energy beyond what our eyes could see. The possibilities were endless. Applications included urban planning, crop monitoring, forest characterization, water quality analysis, and disaster relief among many others.
While photographs taken with film were very powerful, images acquired digitally using a sensor system or a camera were even more so. Satellites were launched that imaged the earth repeatedly and regularly. Initially, these images did not have the same amount of detail (spatial resolution) as the analog photographs, but that quickly changed, and today film is all but obsolete. In addition, these digital sensors have the ability to record in wavelengths beyond what our eyes can see including near infrared, middle infrared, and thermal.

Having a steady source of information generated from remotely sensed imagery about our planet is invaluable. However, could this information be improved? The answer is yes; through geographic information systems (GIS). A GIS allows the user to put together various sources of information by layering the data layers on top of each other to tease out even more information and help in the decision-making process. (Insert image 2 overlay analysis example near here) For example, a university planner may want to determine the best place to build a new campus parking lot. They might download a general land cover/vegetation map (National Land Cover Data from the USGS) that was created from Landsat imagery. Then they might obtain a slope and aspect data layer (also from the USGS generated from remotely sensed imagery). A map of soil types (especially hydric or wetland soils) could be gotten from the Natural Resource Conservation Service (this information was also generated from remote sensing). Finally, the university probably already has a detailed campus map with building footprints and other infrastructure (utilities, pipelines, roads, etc.). An analyst could then use a GIS overlay all these various data sets on top of each other to determine the best candidate locations to build the new parking lot. The decision-makers could specify the criteria they want for the new parking lot. For example, they could say that they want the lot placed on relatively flat land, within 10 minutes walking distance of the central campus, near a central access road, not on a wetland, and where no forest land needed to be disturbed. The GIS could perform this analysis digitally and provide potential locations that meet these criteria. The decision-makers could, if they chose, revise their criteria and quickly get a different set of potential locations.
Clearly, GIS is a powerful tool that has become ubiquitous in our society. Farmers, business developers, politicians, law enforcement, natural resource managers, emergency management agencies, real estate agents, community planners and almost everyone else either uses a GIS or the information generated from one. However, it is important to not lose sight of the source of the vast majority of information input into the GIS. Imagery/remote sensing is the source of many of our GIS data layers. Therefore, a GIS analyst should be aware of the basics of remote sensing so that they not only have an appreciation of how the layers are created, but also so that some evaluation of data quality or accuracy is possible. There is an old adage that is appropriate here; garbage in means garbage out (GIGO). If the GIS user is either unaware of how the data they are using has been created or is using that data in an incorrect/inappropriate manner, then the decisions made with that data could be seriously flawed.
The synergy between imagery/remote sensing and GIS is obvious and undeniable. GIS is highly dependent on having timely and accurate data layers (most generated from remote sensing) to produce effective decisions. The GIS analyst is responsible for choosing the most accurate and appropriate data layers to conduct their analysis and solve their problem. The more informed they are about how remote sensing/imagery were used to create the data layers, the better the decisions made with that data.

Analog remote sensing (aerial photography) since the 1950s, digital imagery and analysis since the 1970s, and GIS since the mid 1980s have developed and improved over time. Since the turn of the last century, these tools have exploded in their usefulness and capabilities.
The number of countries and private companies collecting and distributing remotely sensed imagery has grown exponentially with increased spatial, spectral, temporal, and radiometric resolution such that imagery almost anywhere on our planet is readily available at almost any time. Computers have improved and software has been developed for not only processing the remotely sensed imagery, but also for conducting more effective and efficient geospatial analysis. The future looks very bright with the recent progress in artificial intelligence and deep learning that will enable us to generate better information from the remotely sensed imagery which can then be used in GIS to more efficiently and effectively investigate and understand our modern-day problems and issues. Therefore, it is time for the enlightened geospatial analyst to not only be knowledgeable about geographic information systems and science, but to know at least the basics of imagery and the science of remote sensing.
There are many ways for you to accept this challenge and learn the basics or more about remote sensing. It is fine to start slowly and find some introductory tutorials on such sources as youtube.com, americaview.org, usgs.gov or just type “remote sensing” into your favorite search engine. Once you get going, there are also short courses, workshops, and other lectures that you can sign up to take and books that you can purchase that can teach you more. Finally, there are courses and even certificates and degrees offered at many colleges and universities around the world. The time is now to make use of the synergies between remote sensing and GIS and the geospatial analyst of the future will have skills and knowledge of both!
Russell G. Congalton is associate chair and professor of Remote Sensing and GIS in the Department of Natural Resources and the Environment at the University of New Hampshire. He has over 40 years of teaching and research experience, first at the University of California, Berkeley and now at UNH. He teaches numerous courses in geospatial analysis and has authored or coauthored more than 120 peer-reviewed papers, more than 120 conference proceedings, and fifteen book chapters. He is the co-editor of Quantifying Spatial Uncertainty in Natural Resources: Theory and Applications for GIS and Remote Sensing, and co-author of five books, including Assessing the Accuracy of Remotely Sensed Data: Principles and Practices (1st, 2nd, and 3rd editions, CRC Press); and Imagery and GIS: Best Practices for Extracting Information from Imagery (Esri 2017). Among his many honors, he was elected a Fellow in 2007 and an Honorary Member/Lifetime Achievement in 2016 of the American Society for Photogrammetry and Remote Sensing (ASPRS). He was also presented with a Lifetime Achievement Award by AmericaView in 2022 and the Pecora Award by the USGS and NASA in 2023.
Featured Articles is a special section of the AAG Newsletter where AAG sponsors highlight recent programs and activities of significance to geographers and members of the AAG. To sponsor the AAG and submit an article, please contact meeting@aag.org.
 Laura Conway is currently in the final stages of receiving her GIS Certificate and AAS in Wildlife Management and Conservation from Austin Community College in Austin, Texas. Currently working as a field technician for Bat Conservation International, she sees the internship with AAG to be the perfect addition to rounding out her educational experience before moving on to pursue her BS in Rangeland Ecology. Laura is passionate about spatial ecology and translocation, two fields that strongly connect conservation, geology, advocacy and policy. When she’s not working in caves, she’s enjoying them in her free time or learning a new craft like felting or puppetry. She and her red heeler, Oddy, can also be found outside, swimming or birding.
 Our Media and Science Communication intern is Sean Yates, a sophomore at the University of Georgia double-majoring in Ecology and Geography. Sean is also pursuing a minor in Environmental Law and certificate programs in Sustainability, GIS, and Urban & Metropolitan Studies, hoping to apply his keen interests to a future in sustainable urban development or natural resource management. When not at school or work, Sean enjoys hiking, going to concerts, and watching Atlanta sports. Additionally, he is a big advocate for community service projects and currently volunteers with Athens-Clarke County as a Trail Ambassador on the weekends. Sean is passionate about the geography of the world and has made it a personal goal to visit every national park in the United States.
 Michaela Buenemann, incoming editor for Physical Geography, Earth, and Environmental Sciences, is professor and head of the Department of Geography and Environmental Studies at New Mexico State University. Her interdisciplinary, international, and collaborative work features contributions in GIS, remote sensing, spatial modeling, landscape ecology, and biogeography. She has published in a wide range of geography, environmental sciences, and GIScience journals, and her research has been funded by numerous state and federal agencies. In the classroom and field, she teaches an array of courses in physical geography, socio-environmental systems, field methods, geographic information science and technology, and geographic theory and research design. She has contributed to the discipline of geography in various roles, including chair of the Southwest Division of the American Association of Geographers, Southwest Regional Councilor of the American Association of Geographers, and Southwest Regional Councilor of Gamma Theta Upsilon.
 We are grateful to David R. Butler, outgoing editor for Physical Geography, Earth, and Environmental Sciences. Butler is the Regents’ Professor of Geography Emeritus in the Texas State University System and an AAG Fellow. His research interests include geomorphology, biogeography, natural hazards, mountain environments, and environmental change. In 2023, Butler was awarded the AAG Lifetime Achievement Award for his contributions to the discipline.
 We express our gratitude to outgoing editor Debbie Hopkins, Associate Professor in Human Geography at the University of Oxford, who has steered the publication since June 2020. Along with editorial assistant Neha Arora, Hopkins worked to bring in book reviews that represent the diversity of the discipline and offer fresh perspectives, highlighting what she calls “that real-worldness of our work.”